I turn public web data into dashboards and reports a team can use.
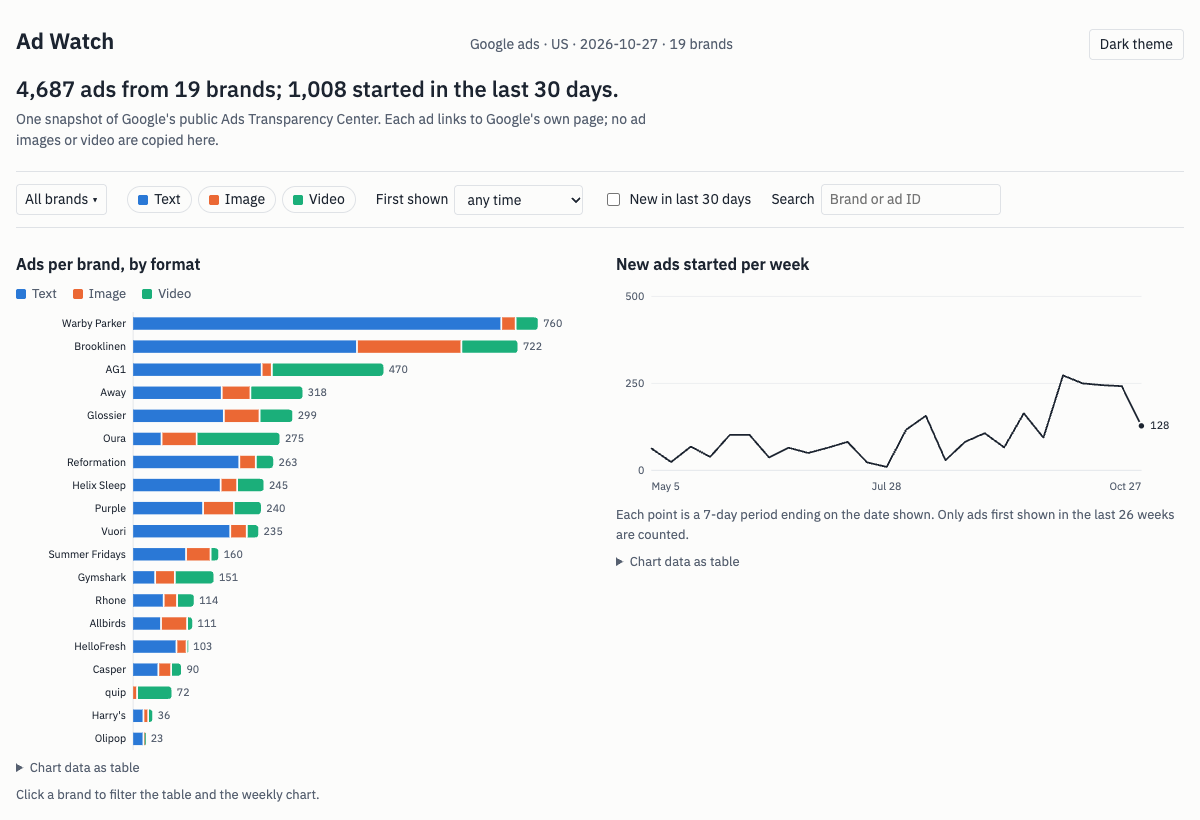
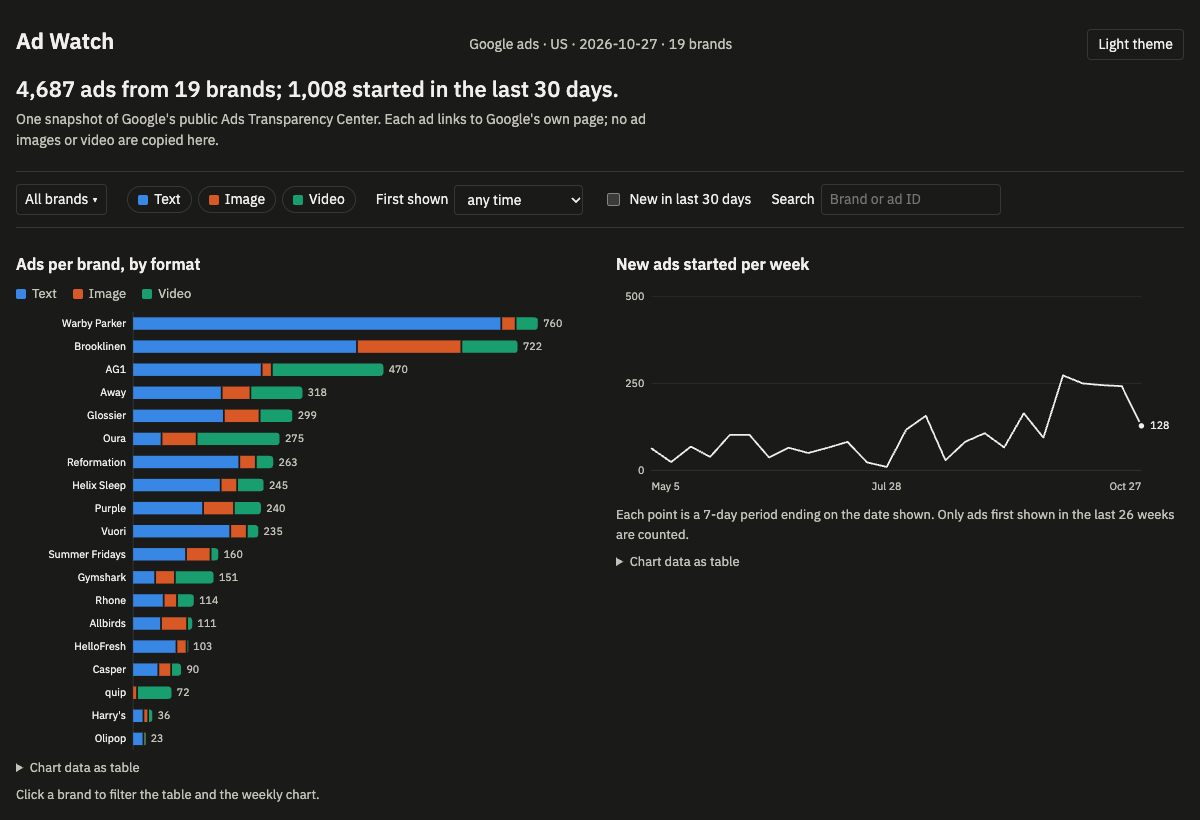
Here is one I built: 4,687 Google ads from 19 direct-to-consumer brands, in a table that stays fast and charts that filter it.
What the data says about how DTC brands advertise
I wanted to see how direct-to-consumer brands run Google ads. Using a scraper I built and publish on Apify, I collected every ad that Google's Ads Transparency Center listed as shown in the US over 30 days for 50 brand domains. 19 of the 50 returned ads: 4,687 in total.
- Text dominates. 61% of the ads are text, 22% video and 17% image.
- Brands differ a lot. 88% of quip's ads and 56% of Oura's are video; 91% of Olipop's and Warby Parker's are text.
- New ads. 1,008 of the 4,687 (21.5%) were first shown in the last 30 days. Brooklinen started the most (244 of its 722); Gymshark had the highest share of new ads (44%).
- Churn. The median Gymshark ad had been running 21 days; the median Warby Parker ad, 756.
Format mix by brand, sorted by video share
Chart data as table
| Brand | Ads | Text | Image | Video | Video share |
|---|---|---|---|---|---|
| quip | 72 | 0 | 9 | 63 | 88% |
| Oura | 275 | 55 | 66 | 154 | 56% |
| Gymshark | 151 | 43 | 37 | 71 | 47% |
| AG1 | 470 | 243 | 19 | 208 | 44% |
| Away | 318 | 168 | 54 | 96 | 30% |
| Rhone | 114 | 59 | 25 | 30 | 26% |
| Purple | 240 | 133 | 58 | 49 | 20% |
| Glossier | 299 | 172 | 67 | 60 | 20% |
| Helix Sleep | 245 | 166 | 31 | 48 | 20% |
| Casper | 90 | 49 | 24 | 17 | 19% |
| Harry's | 36 | 21 | 9 | 6 | 17% |
| Brooklinen | 722 | 422 | 196 | 104 | 14% |
| Reformation | 263 | 201 | 31 | 31 | 12% |
| Vuori | 235 | 184 | 31 | 20 | 9% |
| Summer Fridays | 160 | 101 | 46 | 13 | 8% |
| Allbirds | 111 | 54 | 49 | 8 | 7% |
| Warby Parker | 760 | 693 | 27 | 40 | 5% |
| Olipop | 23 | 21 | 1 | 1 | 4% |
| HelloFresh | 103 | 83 | 19 | 1 | 1% |
What this doesn't show: it is one snapshot of what Google lists, only 19 of the 50 domains returned ads, and it says what brands are running, not what works.
How it is built
A scraper collects the ads, with retries and rate-limit handling. A script turns them into a clean dataset and a short report. The dashboard sits on top. The same three steps work for your data.
What I can build for you
Data feed and report
A recurring dataset or report from public web sources, sent where you work: email, a Google Sheet, CSV or a simple page. See a sample weekly report (PDF, one page)
Dashboard sprint
One clear dashboard on your own data: large tables, filters, charts, and live updates or a map where they help.
Small web app or internal tool
A small working web app from a written spec: an admin panel with login, an order or booking form, or a tool that replaces a spreadsheet. Angular and TypeScript, with a .NET or Python backend.
A typical project: a written spec and fixed quote within 48 hours, a few weekends to build (a data feed usually two to three, a larger app four to six), two rounds of changes, then 30 days of fixes. Fixed price, agreed in writing.
About
I'm a software engineer in Kochi with about four years building data-heavy web applications, mostly Angular and .NET. On the side I build and publish scrapers and small data products. I take one client project at a time and work from a written brief, with no calls, which keeps the scope clear and the price fixed.
Contact
Send a short written brief to ashithprakas@gmail.com: the outcome you want, where the data lives, and a rough budget and date. I reply within 48 hours and deliver on weekends.